| Quick Look |
|---|
|
Main window of IrpTrace consists from: IRP History pane, IRP information
pane and terminal window (see figure 1). The IRP
History pane displays order and type of requests sent at processing of IRP. IRP
information pane shows detailed information about IRP. Terminal pane is
optional. It can receive trace messages of kernel-mode drivers.
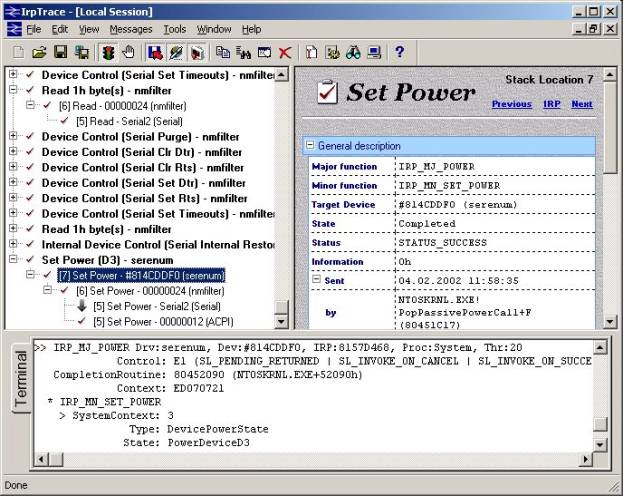
Figure 1: Main window of IrpTrace
|
| IRP History pane |
|---|
|
When driver receive IRP request, it can:
- Complete request by calling IoCompleteRequest
- Set a completion routine, pass request down the stack and complete
request when completion routine is called
- Call IoSkipCurrentIrpStackLocation and pass request down the stack
- Send one or more requests of different type to the lower device then use method 1,
2 or 3 to complete request
IrpTrace provides information enough to
determine used method for any logged IRP. For example, from
figure 2 we can determine that:
- Set power request was sent by NTOSKRNL!PopPassivePowerCall function
- Device 814CDDF0 of NMFILTER driver passed request down the stack
- Device 00000024 of NMFILTER driver set completion routine and passed request
down the stack
- Device Serial2 skipped current stack location and passed request down the stack
- ACPI driver completed the request (ACPI.SYS!ACPIDeviceIrpCompleteRequest)
Figure 2: Set power request
|
| Data output |
|---|
IrpTrace can output IRP request information to:
- a file (main method)
- remote debugger (for example, in output window of Microsoft WinDbg)
- window of a terminal application (for example, HyperTerminal)
running on remote computer.
Click here for an example of IRPTrace usage.
|